Set up AWS CloudWatch alerts and alarms
Need more insight into your AWS cloud? Want to know when something is wrong before it's too late? Use CloudWatch to create alerts and alarms.

Once you have a grasp of AWS CloudWatch terms and the basic flow of the tool, you're ready to create a new metric. To create a new CloudWatch metric, all you need to do is "put" data into it. There's no separate command for creating metrics. To begin working with CloudWatch, input metrics from the command line and view them using the AWS Management Console.
The following line uses the AWS unified command line to create a metric and give it an initial value. AWS used to have separate command-line tools for each product, but this was confusing and required admins to repeat the installation and configuration process. Recently, however, the company introduced a single unified command line that supports most products.
aws cloudwatch put-metric-data --metric-name myMetric –value 40 –timestamp 2001-12-14 12:30
Figure 1 shows a script for monitoring a Cassandra cluster. The first four lines determine the number of servers in the "UN" (up/normal) state and set up a timestamp variable. The last line puts the value to CloudWatch.
Note: The first time you create a metric in AWS CloudWatch, it can take up to 15 minutes.
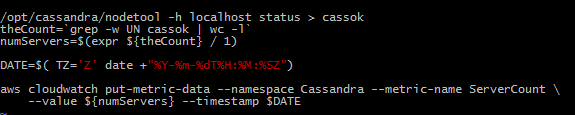 Figure 1. Monitor a Cassandra cluster in AWS CloudWatch.
To create a Topic, select SNS from the services list in the AWS Console and then pick "Create and Add."
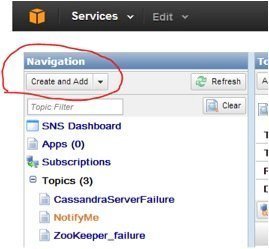 Figure 2. Create a topic from the AWS Management Console.
Give the new topic a Topic Name and DisplayName. If you decide to send alarms as text messages, the DisplayName you create will be in each text message.
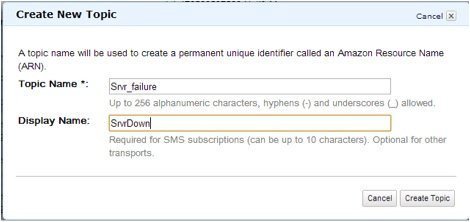 Figure 3. Designate a topic name in CloudWatch.
You now have a topic and an Amazon Resource Name (ARN). For now, choose Create Subscription. A subscription is an email address or cell phone to receive messages from the topic. Enter your email or cell phone number and press Subscribe. You'll get a confirmation mail/text confirmation.
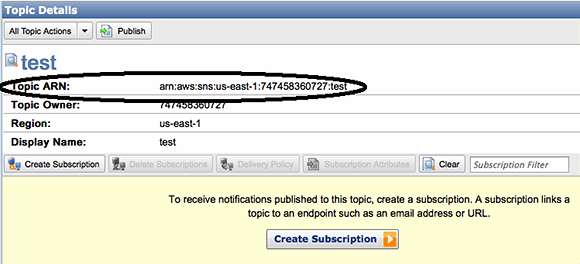 Figure 4. Create a CloudWatch subscription.
Once you have a metric, a topic and a subscription, you're ready to link them to an alarm using Amazon Management Console and the command line.
From the console, select the CloudWatch service, then Alarms and then Create Alarm. Next, select the metric you created earlier and press Next. This brings up the Create Alarm dialog.
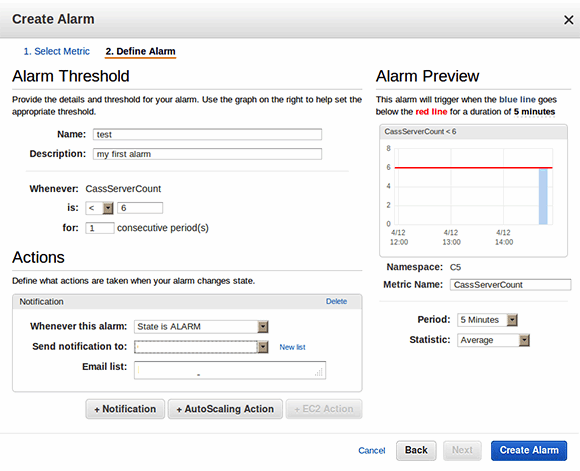 Figure 5. Set and create alarms.
Name the alarm and describe and define when it should alert an admin. In this example, we create an alarm that fires if the metric's value is less than six.
Next, select your topic in the Send notification to box and press Create alarm.
To do this using the command line, enter the following command:
aws cloudwatch put-metric-alarm –alarm-name myAlarm –alarm-description "my new alarm" –metric-name myMetric –namespace myNameSpace –statistic Average –period 300 –threshold 6 –comparison-operator LessThanThreshold –evaluation-periods 1 –alarm-actions <that ARN you got when you created the topic>
Although this command has a lot of parameters, each part makes sense.
Essentially, the command says: Create an alarm with a name and namespace that fires when the average value of the metric is less than six for a single 300-second (five minute) time period, and notify my topic if it does.
So, now you're setup to get convenient text or email notifications whenever there is a problem with your Cassandra cluster -- or any other AWS system you want to measure. The setup is a bit involved, but the end result is worth it.
Helpful hint!
It's much better to respond to a yellow alert, which means the system is slowing, than to a red alert, which signals that the system has collapsed. Yellow alerts are fixable; red alerts usually require a post-mortem.
The next step is to think up new metrics and alarms to automate your operations. What does your system do when trouble is just beginning? Create a metric and an alarm. You can even create multiple alarms on a single metric.
One of the most common alarms IT admins create is specific to Amazon billing. You can set an alarm to sound if you spend more than a certain amount of money per month. Besides being a good way to prevent a runaway bill, this is also a reasonable security measure to detect if someone is using your system without your knowledge.
About the author:
Brian Tarbox has been doing mission-critical programming since he created a timing-and-scoring program for the Head of the Connecticut Regatta back in 1981. Though primarily an Amazon Java programmer, Brian is a firm believer that engineers should be polylingual and use the best language for the problem. Brian holds patents in the fields of UX and VideoOnDemand with several more in process. His Log4JFugue open source project won the 2010 Duke's Choice award for the most innovative use of Java; he also won a JavaOne best speaker Rock Star award as well as a Most Innovative Use of Jira award from Atlassian in 2010. Brian has published several dozen technical papers and is a regular speaker at local Meetups.