Amazon CloudWatch enables administrators to track resources using metrics and log files. Admins should get to know the terminology as well as ins and outs of the auditing service.
Not all enterprises opt for a hybrid cloud environment, choosing instead to operate within a single cloud service provider, such as AWS. Whether an enterprise deploys in multiple clouds or just one, it's imperative to monitor performance and maximize value for the investment. Otherwise, they could miss out on the value of going to the cloud in the first place.
The book AWS Administration – The Definitive Guide, written by Yohan Wadia, takes a broad look at Amazon Web Services cloud deployments. The publication walks readers through security, instance management and the use of Virtual Private Clouds, among other topics. It also explores monitoring AWS resources and applications via Amazon CloudWatch.
The AWS-native tool collects log files and CloudWatch metrics for auditing purposes, helping enterprises run lean in the cloud. And while it's not the only monitoring option for AWS customers, it's one they should know how to use.
This excerpt, from Chapter 6 of the book, gives readers an introduction to Amazon CloudWatch. Administrators should familiarize themselves with various noteworthy CloudWatch metrics and its pricing structure. The publisher of AWS Administration – The Definitive Guide is currently offering $10 off all products site-wide until August 8, 2016.
In this chapter, we will focus primarily on how to monitor your cloud infrastructure, especially your EC2 instances using AWS' monitoring service called as Amazon CloudWatch. CloudWatch is a cheap and easy-to-use centralized monitoring service that provides a variety of features such as alerts, logging, notifications, custom metrics, and much more! So, what are we waiting for? Let's get started right away!
An overview of Amazon CloudWatch
Before we move on to Amazon CloudWatch, it is important to understand the difference in a traditional monitoring solution and a monitoring solution based on the clouds. Unlike your traditional environments, infrastructure in the cloud can scale up and down dynamically in a matter of minutes. Most traditional server monitoring tools cannot match up to this elastic requirement in real time and thus often end up either providing the wrong information or triggering a delayed response. There is also the problem of sheer numbers! A standalone monitoring tool can find it difficult to handle the monitoring of thousands of virtual machines at a single go. Plus, you as sys admins also need to manage the monitoring tool, which adds an extra overhead as well. That's where a cloud-based monitoring solution is so different. A standard cloud-based monitoring tool provides the following feature sets:
Ease of use and management: Most of the cloud-based monitoring tools come with easy integration and management facilities, using which you can start monitoring your cloud infrastructure in minutes.
Dynamically track instances as they are created, add them to the monitoring inventory, and remove them from the inventory when they are deleted.
Trigger real-time events and notifications based on preset alarms.
Monitor the instance's operating system, networking, CPU, and disk utilizations, as well as its applications which can be web servers, databases, application servers, and so on.
Perform/trigger actions based on certain thresholds getting crossed.
These are just some of the key features that are provided by Amazon CloudWatch as well, and you don't have to install or configure it. It's available as a ready-to-use service and you only pay for the amount of service that you use! Awesome, isn't it! Let's have a quick look at Amazon Cloud Watch's overall architecture as well as some of its key components and concepts.
Concepts and terminologies
Before we go ahead and start using CloudWatch, it is essential to understand some of its key concepts and terminologies.
Metrics form the core of Amazon CloudWatch's functionality. Essentially, these are nothing more than certain values to be monitored. Each metric has some data points associated with it which tend to change as time progresses. For example, the CPU usage of any one of your instances is a metric and the values of the CPU usage over a period of time are its associated data points! Each data point has an associated timestamp provided with it along with a unit of measure.
There are a ton of metrics that AWS provides that can be used in as-is scenarios; however, you can additionally create custom CloudWatch metrics as well, as per your requirements. An important point to remember here is that a metric is region specific, which means that a metric is only going to be available in the region in which it was created. A metric is uniquely identified by a name, a namespace, or a set of dimension.
Namespaces are a standard string of characters that you define when you first create a metric. These namespaces act as containers for your metrics and help in keeping them isolated from one another. There is no default namespace provided as such, so you will have to create one for each element that gets added to CloudWatch. By default, all AWS namespaces follow the following naming convention: AWS/<SERVICE_NAME> where <SERVICE_NAME> can be EC2, RDS, S3, and so on. For a full list of AWS namespaces, refer to http://docs.aws.amazon.com/AmazonCloudWatch/latest/DeveloperGuide/aws-namespaces.html.
Metrics form the core of Amazon CloudWatch's functionality. Essentially, these are nothing more than certain values to be monitored. Each metric has some data points associated with it which tend to change as time progresses.
Yohan WadiaAWS Administration – The Definitive Guide
Dimensions are simple key-value pairs that help you identify your metrics. These come in real handy when you need to filter out certain result sets which a CloudWatch query returns. You can assign up to 10 dimensions to a single metric. For example, consider the following combination of dimensions:
Server=WEB, Domain=US-WEST
Server=DB, Domain=US-WEST
Server=NAT, Domain=US-WEST
You can easily retrieve statistics based on these dimension combinations; however, it is important to note that you will not be able to retrieve any statistics for the combinations that you did not create. For example, just querying Server=NAT or Domain=US-WEST or even Server=NAT, Domain=Null will not give you any results as the corresponding metrics were never created.
Time stamps are assigned to each of your metric's data points. These are simple date and time values that are generally provided using the UTC or GMT time zones. The time stamp 2015-09-12T20:45:30Z translates to the September 9, 2015 at 8:45:30 PM as per the UTC time zone. If no time stamp value is provided, then CloudWatch will automatically assign that data point one based on its time of arrival or generation.
Periods are the length of time associated with a particular statistic. To put it in simple words, a period is the time between a start time and the end time. You can specify a period as short as 60 seconds and all the way up to 86,400 seconds, which accounts for a complete day. Periods play a crucial role in the creation of alarms. An alarm is generally meant to be triggered when a certain threshold value is crossed, right? Now in many cases, you will receive false alarms even if these threshold values are crossed for a few seconds. That's just going to flood your mailbox with unwanted notifications! So ideally, we specify the alarms with a threshold and a time period, say 20 seconds. So, if the threshold is breached for more than 20 seconds, only then will CloudWatch raise the alarm. This way you have a more granular control over when your alarms get triggered.
Units help you get conceptual meaning of your metric data. Specifically, these are very similar to units of measure, for example, the metric NetworkIn that is used to track the number of bytes an instance receives will have a measuring unit of bytes (for example, 300 Bytes). Similarly, the metric CPUUtilization which is used to track your instance's CPU utilization will have a measuring unit of Percent (for example, 20% CPU utilization) and so on so forth. Here are some of the units that you will commonly come across when working with CloudWatch:
Milliseconds, Microseconds, Seconds If you do not specify a unit for a metric, then CloudWatch will auto-assign it with the None unit.
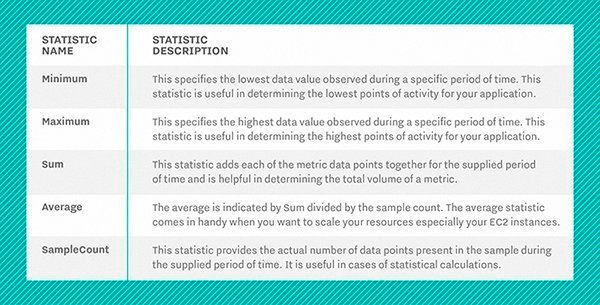
Statistics are metric data that has been aggregated over a period of time. There are five statistics provided by CloudWatch, as described in the following:
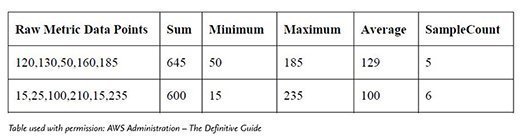
For a better understanding, the following is simple example depicting a few raw metric data points collected over a period of time and their statistics:
An example of raw CloudWatch metrics.
An alarm basically watches over a particular metric for a stipulated period of time and performs some actions based on its trigger. These actions can be anything from sending a notification to the concerned user using the Simple Notification Service (SNS) or something a bit more complicated such as triggering and auto-scaling an event. However, do remember that you can create and associate alarms to any AWS resource provided that they reside in the same region.
Tying it all together, the following is what a CloudWatch alarm basically looks like:
Namespace=AWS/EC2
Metric name=CPUUtilization (Percent)
Period=5minutes
Statistics: Average
Threshold: 70
Dimensions (Name=Web Server, Value="ï-dd42dd1b")
Alarm action: <EMAIL_ID>
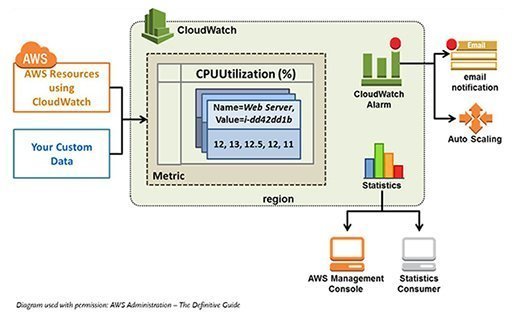
So, we get to know a lot about this alarm just by looking at it. First off, we can tell that this alarm is going to monitor the CPU utilization of one of our specified instances using its instance ID. Secondly, we can also tell that the alarm will monitor the average CPU utilization of the instance. If the CPU utilization breaches the threshold value of 70 percent for a period of 5 minutes, then the alarm will automatically trigger an e-mail notification based on the e-mail ID that you specify. Simple, isn't it! The following is what the preceding example looks like schematically:
This CloudWatch deployment example shows its interactions with other services.