AWS CloudWatch
What is Amazon CloudWatch?
Amazon CloudWatch is a component of Amazon Web Services that provides monitoring for AWS resources and the customer applications running on the Amazon infrastructure.
CloudWatch enables real-time monitoring of AWS resources such as Amazon Elastic Compute Cloud (EC2) instances, Amazon Elastic Block Store (EBS) volumes, Elastic Load Balancing and Amazon Relational Database Service (RDS) instances. The application automatically collects and provides metrics for CPU utilization, latency and request counts. Users can also stipulate additional metrics to be monitored, such as memory usage, transaction volumes or error rates.
Users can access CloudWatch functions through an application programming interface (API), command-line tools, one of the AWS software development kits or the AWS Management Console. The CloudWatch interface provides current statistics that users can view in graph format. Users can set notification alarms to be sent when something being monitored surpasses a specified threshold. The app can also detect and shut down unused or underused EC2 instances.
Amazon CloudWatch is designed for AWS users, including DevOps engineers, IT managers, cloud developers and site reliability engineers.
CloudWatch features
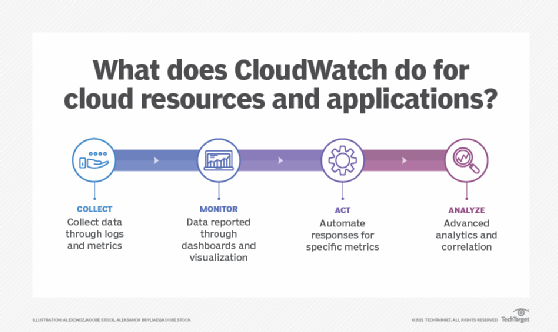
CloudWatch enables users to collect and view monitoring data for AWS infrastructures in a single platform. CloudWatch includes specific features for data collection, monitoring, automated actions, analysis and compliance and security.
- CloudWatch Logs. This service enables users to collect and store logs for vended services for customers, logs for specific AWS services such as AWS CloudTrail, AWS Lambda, Amazon API Gateway, Amazon Simple Notification Service, or for proprietary applications and on-premises resources. CloudWatch Logs Insights can provide quick queries and visualization of log data.
- Metrics collection. Users can collect default metrics from more than 70 distributed AWS applications and view them in one place. They also can collect metrics and customize logs from their own applications or on-premises resources.
- Container Insights. This feature collects, aggregates and monitors metrics and logs for containerized applications and microservices. It can also troubleshoot Amazon Elastic Kubernetes Service and Amazon Container Orchestration Service.
- CloudWatch Lambda Insights. This service collects, aggregates and monitors AWS Lambda logs and performance metrics from each container, including CPU, memory and disk information.
- Contributor Insights. This feature provides a view of the top contributors influencing system performance, such as API calls, applications or customer accounts.
- Unified view. This feature enables users to create dashboard views for selected applications, graphs and other visualized cloud data.
- Composite alarms. This function unifies alarms for different issues affected by the same application into a single notification. This can help root-cause diagnosis.
- High resolution alarms. Users can set thresholds for specific metrics that trigger alarm actions, such as shutting down unused instances.
- Correlation. CloudWatch can correlate specific patterns in logs with metrics to diagnose a root cause.
- Application Insights for .NET and SQL Server. This feature provides easy monitoring for .NET and SQL Server applications, with automated dashboards and smart metrics.
- Anomaly Detection. Machine learning algorithms can detect abnormal activity in AWS systems.
- ServiceLens. This service monitors the performance, health and availability of applications and dependencies to reduce bottlenecks, recognize affected users and diagnose root causes.
- Synthetics. This facility monitors application endpoints and alerts the user to errors and abnormal infrastructure issues.
- Metric Streams. This feature enables users to create near real-time metric streams to other applications, such as Amazon S3, or share them with third-party service providers.
- Auto Scaling. This feature automates capacity and resource planning.
- CloudWatch Events. This service provides a near real-time stream of system events and automates responses to operational changes.
- Log analytics. Advanced analytics are available for the information in CloudWatch Logs, without provisioning additional servers or the need for extra software. Queries can be exported to dashboards.
- Integration with AWS Identity and Access Management. This facility provides a management console to control which users and applications have access to CloudWatch data and resources.
CloudWatch vs. CloudTrail
CloudWatch and CloudTrail are both monitoring services for AWS resources and applications.
AWS CloudWatch is a service that monitors system performance for AWS applications and resources, and AWS CloudTrail is a web service that monitors the activity within the AWS environment through tracking API calls.
CloudTrail provides a detailed log of all actions in the AWS system, and helps users track user activity and changes, monitoring the trail of activity, hence the name. AWS CloudTrail provides information on the who, what, where and when of activity in the AWS account and environment.
Benefits of CloudWatch
CloudWatch offers several benefits for organizations using AWS resources and applications. These are related to the information that CloudWatch can provide, as well as its intuitive interface, and include the following.
- offers ease of use for basic functions;
- provides visibility for all AWS monitoring data on one platform;
- effectively collects metrics for AWS environments;
- increases and optimizes operational performance of AWS and on-premises resources;
- provides insights into correlations and other relationships in system performance;
- provides stability and reliability; and
- offers integration with other AWS resources.
Challenges of CloudWatch
related to the use of AWS CloudWatch include the following:
- costs more than most third-party monitoring and log tools;
- many standard AWS metrics cannot be seen in units smaller than one-minute intervals;
- advanced integration is mostly limited to AWS resources; and
- more advanced use of CloudWatch can have a high learning curve.
Amazon CloudWatch pricing
CloudWatch is available in free and paid tiers. The free tier includes limited monitoring metrics, API requests, dashboards, alarms, log data, events, contributor insights and canary runs.
Like other cloud services, the paid tier follows a pay-as-you-go pricing structure that is billed monthly. Pricing is based on the quantity of metrics, APIs and metric streams used.
See the AWS CloudWatch pricing page for a comprehensive breakdown with a pricing calculator and pricing examples.
Amazon CloudWatch use cases
CloudWatch collects data for operational and monitoring purposes with a unified view and can deploy automated responses to monitored metrics reaching a specified threshold. More broadly, CloudWatch is used for the following tasks:
- to help fix operational issues and optimize performance using log analytics;
- monitor AWS applications in the cloud or on premises;
- monitor and troubleshoot the AWS infrastructure; and
- optimize system resources.
For more information on metrics in cloud monitoring, read here.
Learn how AWS CloudWatch compares to other cloud monitoring services.