Custom AWS metrics maximize use of CloudWatch Logs
Unlike standard app dev methods, serverless computing with AWS Lambda does not enable easy debugging. These tools can help developers keep an eye out for Lambda errors.
There are several AWS Lambda tutorials, tools and frameworks available for developers looking to build and manage serverless applications. But information on debugging Lambda is still needed.
Lambda functions are not like standard application deployments. Developers can't SSH into a server to look through log files, see output or run test commands to see what went wrong. Lambda functions run a just-in-time environment, spinning up a new container and executing code, then quickly destroying that container within a few minutes. While it's possible to reuse some containers, developers can't access containers for failed functions to determine what went wrong.
Instead, developers must use logging tools, such as Loggly or CloudWatch Logs with Kibana, to diagnose problems. They can also use tools like the newly open sourced AppEnlight to manage custom AWS metrics for Lambda.
Diagnosing issues using log management
The simplest option is to use Amazon's built-in CloudWatch Logs; these allow developers to search through logs via a built-in console or index logs in Amazon Elasticsearch Service (ES) with Kibana. However, Amazon ES can be very expensive with a large amount of logs.
Lambda functions run a just-in-time environment, spinning up a new container and executing code, then quickly destroying that container within a few minutes.
Developers can use CloudWatch Logs via CloudWatch metrics for basic alerts and graphing, but these metrics must be set up first. There is no way to retroactively add AWS metrics and see history from before a metric was created. Additionally, many AWS metrics, such as advanced timing and graphing based on plotted, are not available in CloudWatch Logs. Developers can only use those features with Kibana.
There are also several tools to track CloudWatch Logs, such as the built-in log functionality of Apex. This feature lets developers view logs in near real-time after deploying an app or while trying to actively diagnose an issue.
The best option is to access logs using CloudWatch Logs and then send JSON-formatted log messages. These messages display complex data within logs and help provide IT teams with information needed to resolve an issue. But logs are usually not enough -- you can't track advanced issues, such as when functions time out or toss an exception from an asynchronous function, with log lines.
Using AppEnlight for advanced diagnostics
NewRelic and other application performance monitoring tools are powerful for web-based application diagnostics, but they don't perform in environments that don't have a persistent state or any direct web-based requests, such as Lambda. AppEnlight is a tool that provides performance and error-logging capabilities to any application, even if it is not web-based.
Because AppEnlight is open source, it's adjustable. I created a NodeJS package manager module called appenlight-reporter to help instrument Lambda functions. After signing up for a free AppEnlight account, developers can create a new AppEnlight Reporter instance to add AppEnlight instrumentation:
var AppEnlightReporter = require('appenlight-reporter');
var appEnlight = new AppEnlightReporter({
api_key: ‘API-KEY',
});
Code instrumentation refers to the ability to trace error reporting, resource logging or how long it takes for an operation to occur. Code instrumentation provides detailed analysis on why a particular block of code -- or an entire application -- is taking a long time to process or why it fails entirely. For example, code instrumentation shows how long it took to receive a request from MySQL and what error messages occurred during that time. Some frameworks, such as NewRelic, provide automated instrumentation for code; others allow for custom transaction tracing, which requires developers to mark the start and end of code blocks.
DevOps teams can configure the reporter to connect directly to the custom hosted instance by passing the endpoint option. They can also use default tags and a custom server_name.
The AppEnlight Reporter can profile custom function calls and AWS metrics; it also sends error reports directly to AppEnlight. Developers can use the following code to send a custom metric to AppEnlight:
appEnlight.sendMetrics(‘metricName', [
[‘tagName', ‘tagValue'],
[‘numericTag', 0],
]);
Use this code to send error reports to AppEnlight:
appEnlight.sendReport({
view_name: ‘functionName',
priority: 8, // Should be 0-10
error: ‘Details of the Error that occurred',
http_status: 500,
tags: [
// Custom tags just like with sendMetrics
],
start_time: start_date.toISOString(),
request_id: context.awsRequestId,
});
It is recommended that developers send context.awsRequestId, as that helps to line up requests with logs that are sent. If used with the winston-appenlight package, log lines will show up for any error reports that are sent. DevOps teams can also use a simple Lambda function to send all logs from CloudWatch Logs to AppEnlight along with the request IDs, simplifying the logging process.
Reading AppEnlight dashboards
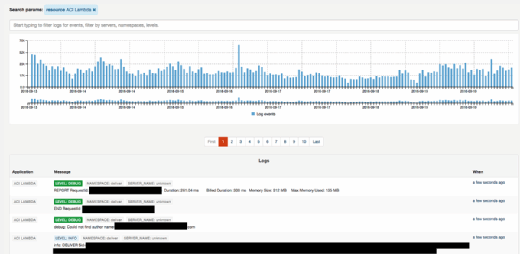
Once AppEnlight receives data from Lambda functions, DevOps teams can use two primary features to diagnose issues. The Logs section allows developers to search full text of log lines and filter by tags, function names and resource.
AppEnlight provides an interface for developers to check Lambda logs.
Developers can also see graphs of log events and select a tag to add a filter.
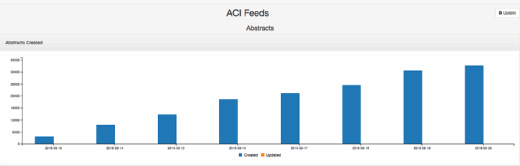
In addition to Logs, AppEnlight has a dashboard system for viewing statistics on custom metrics. The following dashboard was created using the custom metric Created filtering via the tag New Abstract:
The AppEnlight dashboard allows developers to create custom metrics, such as Abstracts Created.
Dashboards can also have multiple charts that combine statistics from both AWS metrics and log lines.
AppEnlight has an error reporting method; for each sendReport function call, DevOps teams can see a list of all errors sent and how many times that specific error occurred. Teams configure logs so they're sent with the same RequestID as the error report. Those logs are presented directly within the error report:
Developers can check error report history within AppEnlight.
The free hosted version of AppEnlight has a limit on how much data is accepted. The free version can help developers get acclimated with the service, but they'll likely have to upgrade to the paid version for its full benefits. DevOps teams that run their own custom hosted version of AppEnlight have no data restriction, so that's recommended for any application with large volumes of mission-critical data.
The open source AppEnlight tool allows users to submit Pull-Requests to the code repository to improve performance and test new releases. A Docker container version of the tool is also reportedly in the works.